Paper in Valeur, H. (2014) India: the Urban Transition – a Case Study of Development Urbanism. Copenhagen, The Architectural Publisher, pp. 114-141.
Table of Contents
1. Water pollution
1.1 Mavallipura – the dumpsite
1.2 Sources of pollution
1.3 The holy rivers and the fertile land
1.4 Health effects
1.5 Diarrhea
2. Water stress
2.1 Variables
2.2 Inequality
2.3 The water footprint
2.4 Farming
2.5 Urbanization
3. Conclusion
Abstract
While “the green revolution” certainly helped prevent famine, the introduction – in India during the late 1960s – of chemical pesticides and fertilizers, water-intensive crops and groundwater irrigation has contributed significantly to the pollution and depletion of water and also to population growth, which, in combination, have reduced the amount of available water per person by more than 2/3, causing water stress today and possible scarcity within the next few decades. So far, most of the population growth has taken place in rural areas. But from now on, almost all of the growth is expected to take place in urban areas. The future water situation in India, therefore, will increasingly be determined by the capability of its cities to conserve and recycle water.
1. Water pollution
According to the “Performance Audit of Water Pollution in India” by the Comptroller and Auditor General of India:
“Water contamination weakens or destroys natural ecosystems that support human health, food production and biodiversity. Water-borne diseases kill millions people […]. Livelihoods such as agriculture, fishing and animal husbandry are affected by poor water quality”.
Yet …
“Presently, only about 10 per cent of the waste water generated is treated; the rest is discharged as it is into our water bodies”.1
Wastewater is, however not the only problem.
1.1 Mavallipura – the dumpsite
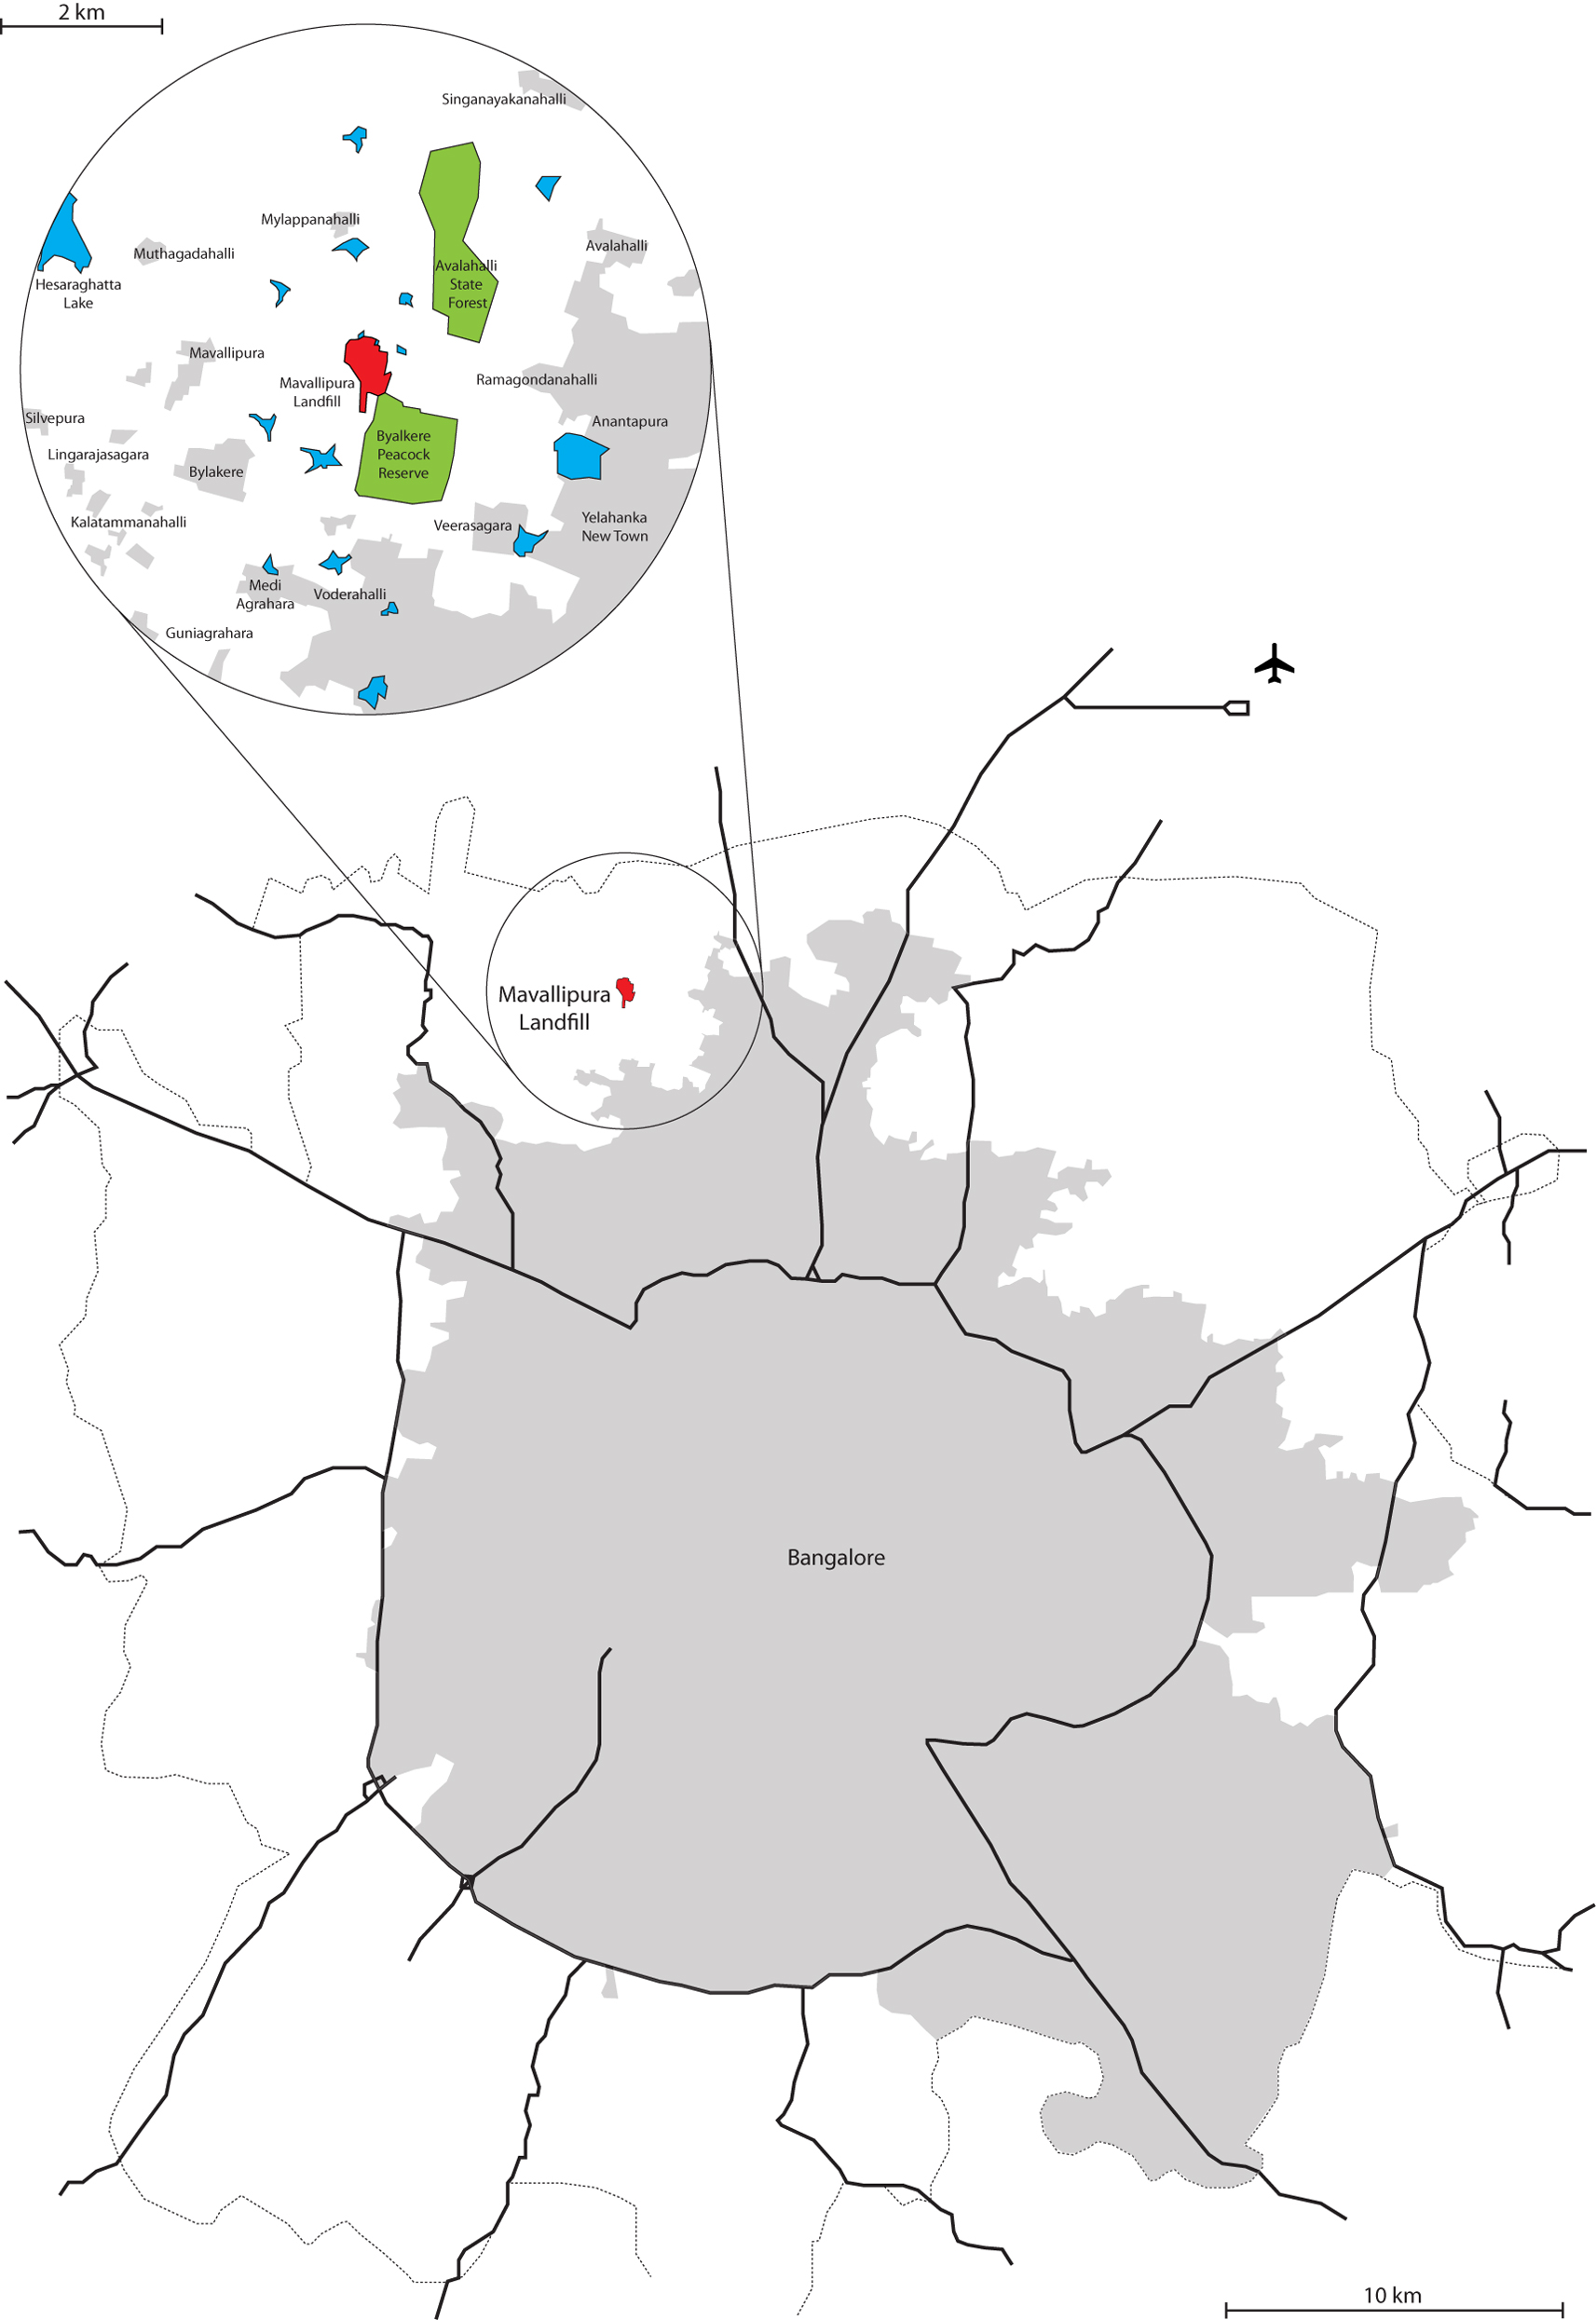
During the past decade, the city of Bangalore dumped more than a million tons of solid waste at Mavallipura, a landfill – surrounded by agricultural land, lakes and villages – located just outside the city, between the Avalahalli State Forest and the Byalkere Peacock Reserve.2
According to environmentalists and local residents, highly toxic leachate has begun leaking into the nearby lakes, streams and groundwater while the inhabitants of the surrounding villages have begun to suffer from abnormally high levels of cancer, kidney failure and gastro-intestinal disorders.3
Animals are reported to have died from drinking the water while mosquitoes – and with them, malaria and dengue fever – proliferate. However, what finally stirred the State Pollution Control Board to put a stop to the practice of dumping garbage at Mavallipura was maybe not so much the health of the villagers as it was the rumor that the water of the nearby Arkavati River, which provides drinking water to the city of Bangalore, was being contaminated along with the fact that the expanding city was rapidly approaching the terrain of this particular area, having already expanded into the nearby Yelahanka New Town – once a model satellite town located far outside the city at the time that it was built in the 1970s – the population of which tripled – from around one hundred thousand to around three hundred thousand inhabitants – during the last decade (2001-11).4
Nevertheless, mountains of untreated solid waste remain and even though the waste has been covered with earth, it becomes exposed after the heavy rainfall that pours down during the monsoon season.
1.2 Sources of pollution
Water safety is threatened by pollution from a wide range of human activities. This includes untreated domestic waste and sewage, especially from urban households,5 industrial effluents and toxic substances, agricultural run-off from fertilizers and pesticides.
However, water safety is also threatened by natural contamination:6 for instance, the intrusion of saltwater from the sea, which contaminates the soil, the surface water and groundwater aquifers.7 Salinity also occurs in many inland areas like the arid regions of Rajasthan and Gujarat, where “ground water salinity is so high that the well water is directly used for salt manufacturing by solar evaporation”.8
Water pollution from agriculture can be traced back to the so-called “green revolution”, launched in India in the late 1960s. The introduction of modern farming methods and technologies, chemical fertilizers and pesticides, high-yield crops and intensive irrigation helped reduce malnutrition and starvation, thus improving the chances of survival while increasing life expectancy.9 But it also allowed the population to grow at a rate of more than 20 percent per decade during the second half of the 20th century,10 putting further strain on the water resources. And it led to severe land degradation, to the depletion of groundwater and to the pollution of both surface and groundwater.
Agriculture can be held accountable for 55 percent of the pollution of the water in India. The remainder comes from domestic use (26 percent) and industrial production (19 percent).11
Industrial water pollution includes chemicals, pharmaceuticals and heavy metals from factories, foundries, laboratories and tanneries. A report on industrial water pollution in India describes how the Amla Khadi, a tributary of the Narmada river in the state of Gujarat, “carries extremely toxic, often acidic, dark brown or black effluents around the year”.12
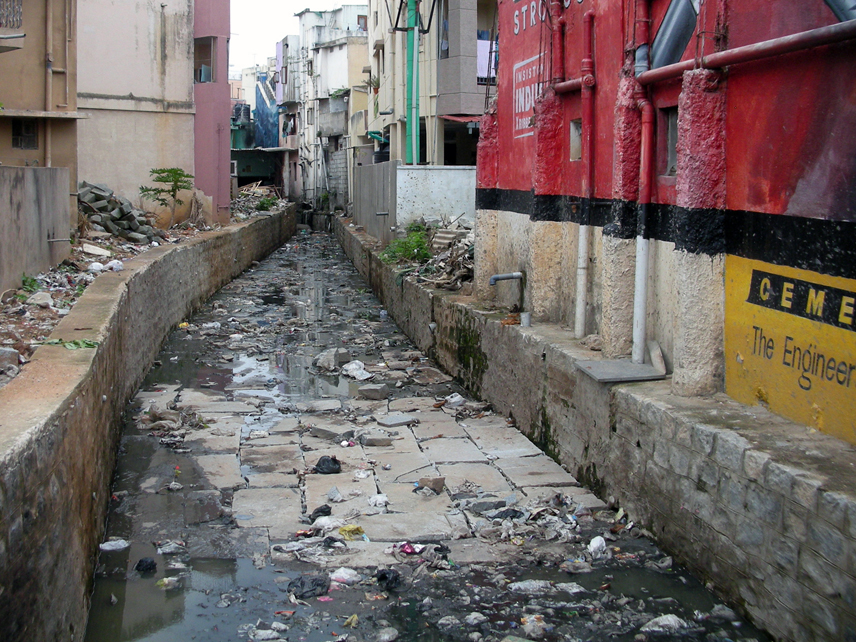
In many cases, industrial wastewater is dumped directly into local rivers and streams without prior treatment.13
The same goes for much of the urban household sewage: “Indian cities produce nearly 40 billion liters of sewage every day and barely 20 percent of it is treated.”14
Larger cities, of course, produce more sewage than smaller cities. On top of that, the average inhabitant of metropolitan and class-I cities generates considerably more sewage than the average inhabitant of the smaller class-II cities.15
Larger cities, however, have relatively more treatment capacity, with metropolitan cities having a treatment capacity for more than 50 percent of the sewage they generate, while class-I cities have capacity for less than 20 percent and class-II cities for less than 10 percent of the sewage they generate.
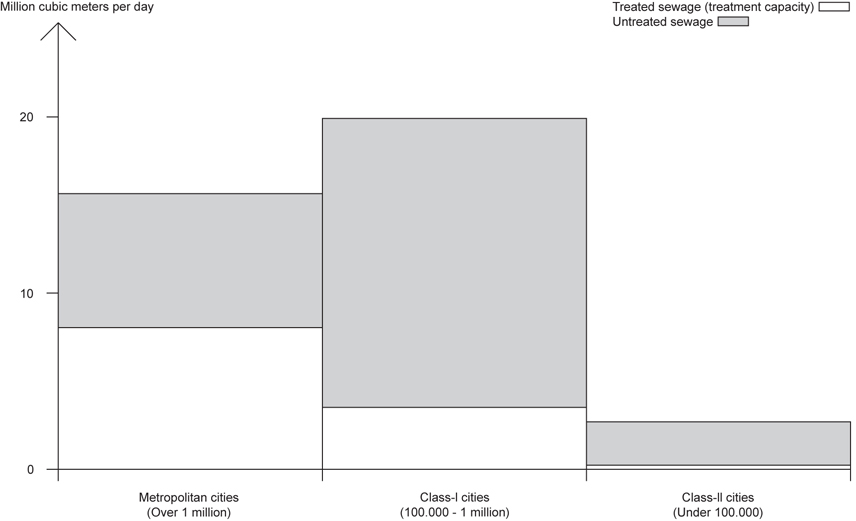
“A large number of […] cities/towns either do not have any sewerage system or the sewerage system is overloaded or defunct. Even where sewers exist, they often leak or overflow, releasing their contents to storm water or other surface drains or percolate into soil to reach ground-water.”16
Regular flooding due to the monsoon and extreme weather conditions further exacerbate the problem of water pollution.17
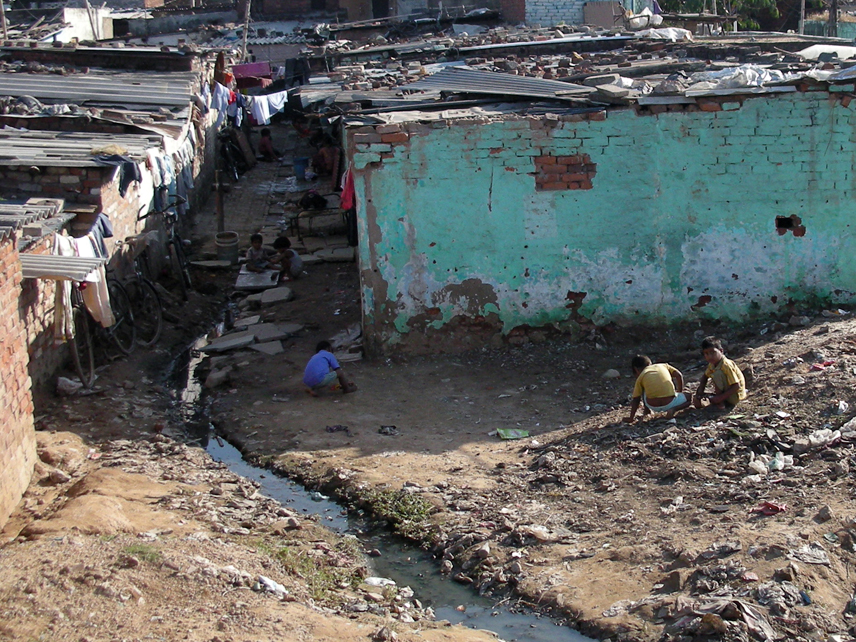
And even though the majority of the urban population in India has access to improved sanitation,18 there are still 50 million people who perform open defecation in Indian cities.19
1.3 The holy rivers and the fertile land
Most cities in India are located on the banks of a river and even though many rivers are held to be sacred and even though water is considered the most precious resource, most of the urban waste ends up in the rivers.
Even in the nation’s capital, only about half of the residents are connected to the city’s sewage system – and Delhi has the largest capacity for sewage treatment of all the cities in India.20 The rest of the people flush their wastewater directly into the Yamuna River, in which many people wash their clothes and their bodies.
The Yamuna originates in the Himalayas and flows parallel to the Ganges River, through Delhi and past the Taj Mahal in Agra, until the two rivers meet in Allahabad,21 where, in 2013, on a single day during the Kumbh Mela, an estimated 30 million Hindu pilgrims took a bath.22
Despite having spent over 17 billion rupees on cleaning these two great – and greatly polluted – rivers, governmental authorities in India were quoted in 2009 as saying that the “rivers Ganga and Yamuna are no cleaner now than [they were] two decades ago”. 23
From Allahabad, the Ganges continues eastwards to the Bengal Delta, where it meets the Brahmaputra River before emptying into the Bay of Bengal. The area around the Ganges River is known as the Ganges Basin, which is historically a highly productive agricultural area, an area that is home to more than half a billion people – making it the largest concentration of human beings on Earth.24
1.4 Health effects
Water pollution may affect food safety and security while causing degradation of eco-systems and reduction of biodiversity and, last but not least, adversely affecting human health.
Many diseases are waterborne, with bacteria, viruses and parasites spreading through contaminated water and concomitant infection occurring while bathing, washing, drinking and eating. Contaminated water is said to be the main cause of the rising child mortality rate in India.25
Waterborne diseases include cholera, dysentery and typhoid. Malaria and dengue fever are transmitted by mosquitoes while intestinal and parasitic worms, which also proliferate and spread through contaminated water, may be the cause of malnutrition, anemia, retarded growth and severe diseases. Natural pollutants in water, like arsenic and fluorides, may cause skin ailments, cancer and bone diseases. Industrial pollutants, including pollutants from industrialized agriculture, may have some of the same deleterious health effects as natural pollutants in addition to giving rise to possible neurological effects and alterations of the chromosomal makeup of future generations.26
1.5 Diarrhea
Diarrhea is one of the most common waterborne diseases in India,27 with five percent of the disability-adjusted life year (DALY)28 in India caused by diarrhea alone.29
Less than one in a thousand cases of diarrhea is fatal30 but it can be quite dangerous to children, with as many as a quarter of a million children under the age of five dying of diarrhea every year in India.31 And even though the vast majority of children do survive, fortunately, repeated episodes of diarrhea make them vulnerable to other diseases and to malnutrition. According to UNICEF: “children in [India] are shorter and more underweight because their bodies use up all [the] energy to fight frequent infections, lowering their strength and growth.”32
2. Water stress
Until quite recently, India enjoyed abundant water resources but population growth, overexploitation and pollution have given rise to a situation where the demand for water is increasingly exceeding the supply.
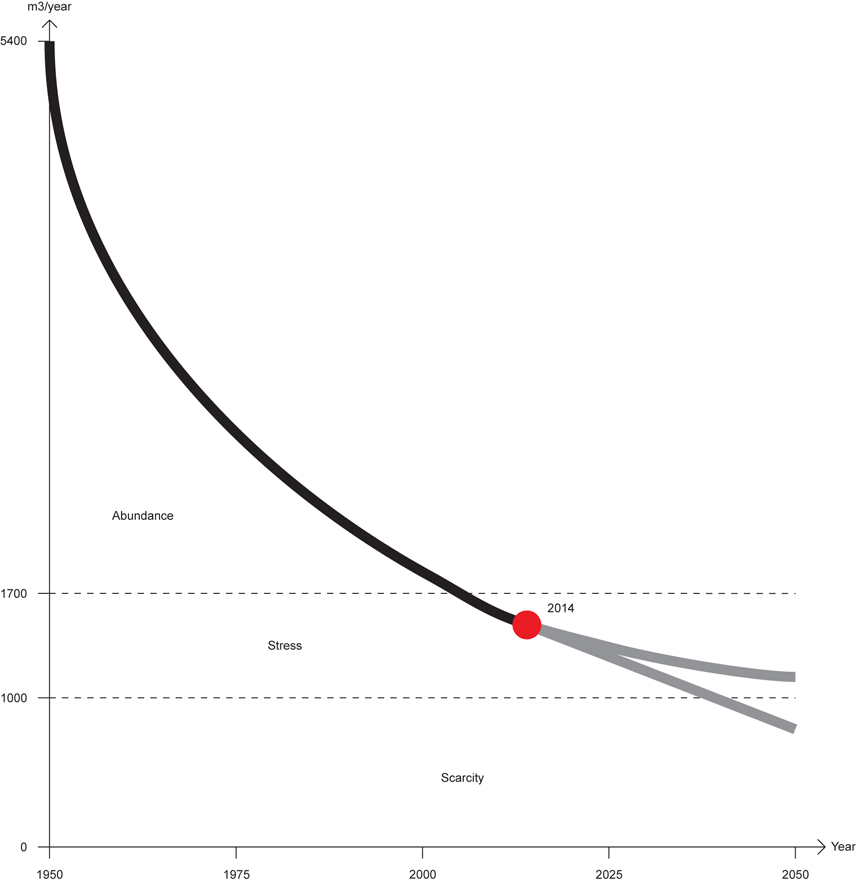
The country is, according to official estimates, currently using 634 billion cubic meters of water per year while the utilizable resources of water33 stand at 1,123 billion cubic meters, or almost twice as much.34 Other estimates, however, put the figures for “utilizable resources” very close to the figures for “current use”.35 Considering that the availability of water is very unevenly distributed, in both spatial and temporal terms, this would mean that some regions are already experiencing periodic water scarcity.
2.1 Variables
The monsoon season provides nearly 90 percent of India’s total rainfall in just three months, causing flooding in some areas and drought in others.36 The distribution of rainwater may be further skewed by climate change that is believed to be caused largely by the emission of greenhouse gasses, 70-80 percent of which cities contribute.37
The water that flows through the rivers also varies greatly with the water-flow of just two rivers – the Ganges and the Brahmaputra – accounting for 60 percent of the total water-flow of rivers in India.38 And since these two rivers only pass through the north/northeastern part of the country, the water-flow of rivers in other regions is often under immense stress, a situation that frequently gives rise to disputes between neighboring states.39
The pollution of its rivers, streams, lakes and wetlands has made India increasingly dependent on its groundwater.40 Thus, 1/4 of the world’s total use of groundwater can be attributed to India, making it the largest groundwater user in the world.41 However, groundwater is also very unevenly distributed, with some regions being naturally arid while others experience water shortage because of overexploitation.42
2.2 Inequality
The cost of clean water will most likely increase, perhaps even dramatically, as it becomes scarcer; this may also affect the cost of food. Subsistence may thus become much more costly.
The poor are already often paying more for water than the rich43 because a large number of poor people don’t have access to public water, which is provided at a subsidized rate. In fact, according to a World Bank study: “40% of the poor […] do not use any public water services.”44 Instead, they have to rely on more expensive water from private suppliers.45
Apart from not providing much relief to the poor, the artificially low tariffs on public water may also serve to discourage those people with access from saving water. And without increased revenues, the maintenance and the management of public water systems will likely remain under-funded, further contributing to the loss and waste of water.
2.3 The water footprint
Still, the average Indian water footprint46 (of consumption) is about one thousand cubic meters per year, while that of an average American is almost three thousand.47
Much of this disparity can be explained by the very large number of vegetarians, which makes India the country with the lowest per capita consumption of meat. By contrast, Americans have the second highest per capita consumption of meat in the world.48 And the water footprint of meat is many times greater than that of vegetables.49
Thus, despite being home to 18 percent of the world’s population, India’s water footprint (of production) is less than 13 percent of the world’s total.50 Unfortunately, the country only holds 4 percent of the world’s renewable water resources.51
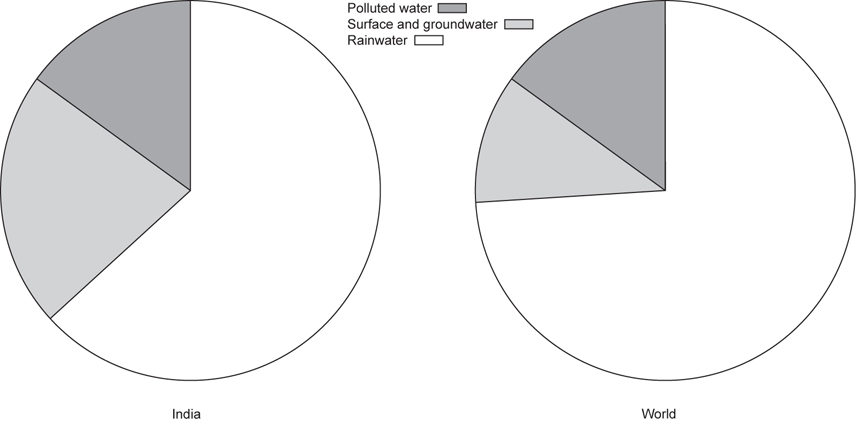
To make matters worse, India depends much more on surface and groundwater resources than does the rest of the world, while it makes much less use of rainwater.52
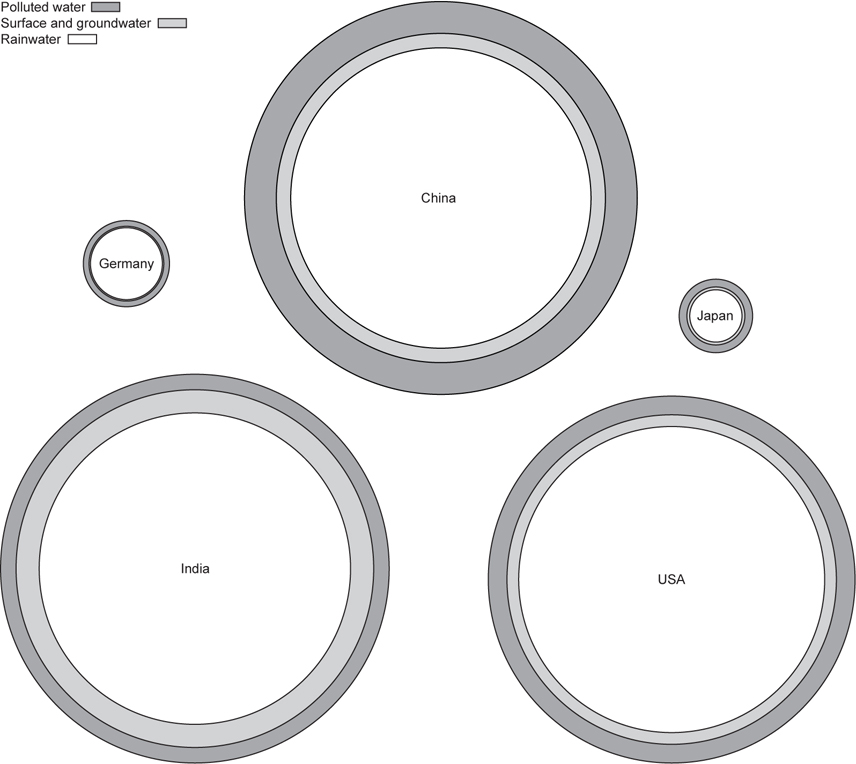
(surface and groundwater) footprint was 243 Gm3/year, which was almost the same as that of
China (142 Gm3/year) and the United States (117 Gm3/year) combined. China’s grey (polluted
water) footprint was 360 Gm3/year, which was almost the same as that of the United States (204
Gm3/year) and India (180 Gm3/year) combined. The United States’ total water footprint was
1,053 Gm3/year, which was more than ten times the total water footprint of Germany (58 Gm3/
year) and Japan (42 Gm3/year) combined and almost as much as that of China (1,207 Gm3/year)
or India (1,182 Gm3/year) despite its population being only about 1/4 of China’s or India’s. “The
grey water footprint estimates in this study are to be considered as conservative”, according to
the authors. The grey water footprint is polluted water or, more precisely, the amount of water
needed to dilute pollution. Source: National water footprint accounts: the green, blue and grey water
footprint of production and consumption; Mekonnen, M.M. and Hoekstra, A.Y.; 2011. Image © Henrik Valeur, 2013.
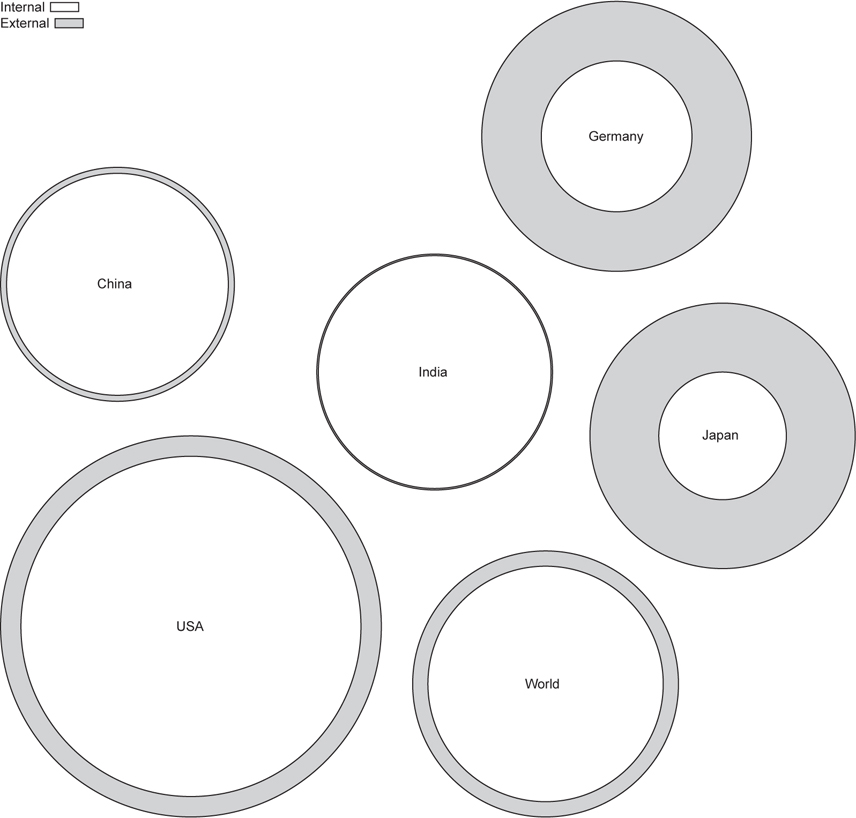
In addition to having considerably less water resources per person than the world average, India exports a significant portion of its water, especially through agricultural products,53 while only a small fraction of its water footprint (of consumption) stems from imported products (external).
2.4 Farming
Because rainfall in India is erratic, farmers used to construct common systems of tanks and canals to collect and distribute water for irrigation. But following “the green revolution” and the provision of subsidized electricity for drilling and pumping water, farmers increasingly began to use the groundwater from private wells for irrigation.
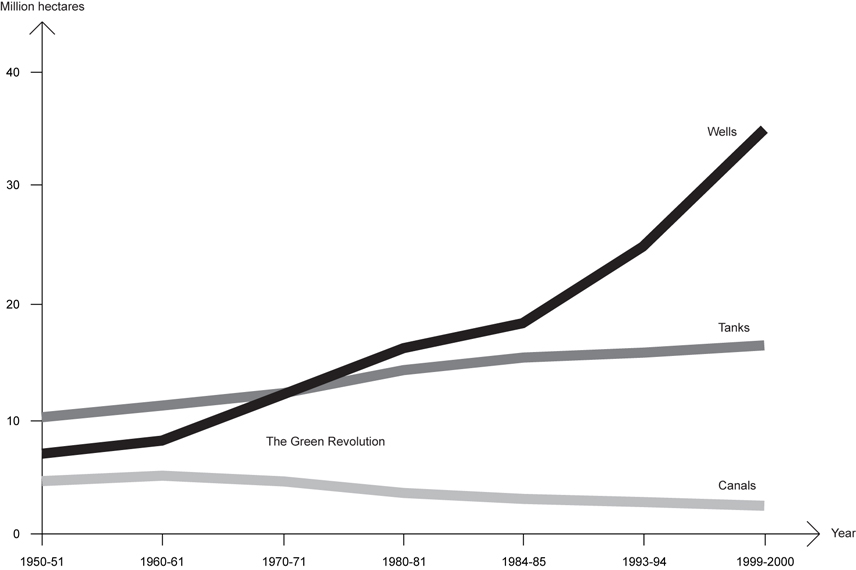
This has not only made farming more efficient but has also enabled farmers to cultivate more land.
Today, “more than 60 percent of irrigated agriculture in the country is dependent on groundwater, with the crop water productivity of groundwater irrigated farms being almost twice that of surface water-irrigated farms.” As a result, the groundwater table is rapidly declining in many parts of the country and “an increasing number of aquifers [are reaching] unsustainable levels of exploitation”.54
Decreasing levels of groundwater and increasing levels of pollution of the surface water are serving to make farming more and more expensive and a growing number of farmers are now finding themselves trapped in debt, which may explain the unusually high number of suicides among Indian farmers in recent years.55
In some places, the groundwater table has now become so low that farmers – the ones who can afford to do so – “are using modified oil-drilling technology to reach water, going as deep as 1,000 feet in some locations”.56
Others farmers are selling off the groundwater from private wells for consumption in cities instead of using it for irrigation. And while more than 90 percent of the total water consumption in India can be attributed to agricultural production,57 an increasing share of that produce goes to feeding a growing urban population. Moreover, most of the water used for industrial production and most of the domestic water use can be attributed to cities.
2.5 Urbanization
Urban growth may adversely affect the water situation in India because urban dwellers use more water – and consequently generate more wastewater – than rural dwellers58 while they simultaneously contribute indirectly to the increased consumption and contamination of water through their demand for water intensive agricultural and industrial products.59
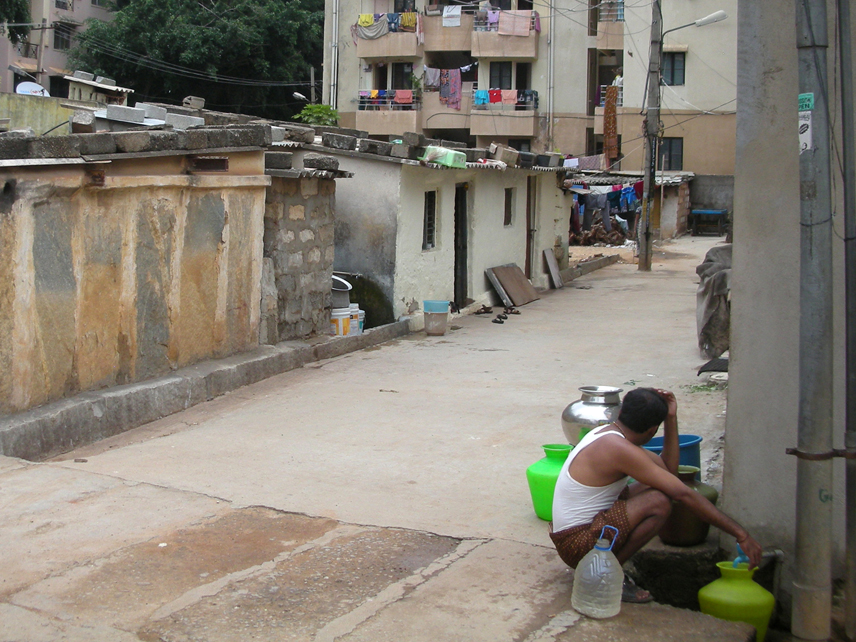
The modernization of Indian cities, including the provision of running water supply and the introduction of “urban” amenities like flush toilets, bathtubs and washing machines leads to increased water consumption. Still, only half of the urban population in India has access to piped water on the premises60 and most cities only get piped water for a few hours per day. In some cities, there’s piped water only on certain days!61
As a result, more and more water is supplied from private – often unregulated and illegal – bore wells.62 This contributes greatly to the depletion of groundwater reserves.
However, there are great opportunities for water conservation and recycling in cities because the high concentration of people actually makes both the efficient distribution of water to everybody and the efficient treatment of wastewater from everybody technically feasible.
Meanwhile, the widespread use of flat roofs in Indian cities makes them ideal for harvesting rainwater for domestic, industrial and municipal use and ideal for establishing private and community kitchen gardens, which can offset consumption and the contamination of water from conventional agriculture.
3. Conclusion
India is prone to natural disasters caused by too much water, such as torrential rain and flooding rivers. This may be further aggravated by climate change, which can also lead to rising sea levels and melting glaciers. However, it is the lack of water that poses the most serious long-term threat to life on the subcontinent.
India used to have abundant water resources but during the second half of the 20th century, as the population tripled, the amount of available water per person was reduced to 1/3 of what it had been. It seems that this trend is continuing into the 21st century, with the country recently reaching the level of water stress and with the prospect of widespread scarcity occurring within a few decades.
Aside from population growth, the main reasons why India is running out of water are:
- Pollution of surface and groundwater (caused mainly by human activities)
- Depletion of groundwater (caused solely by human activities)
- Uneven and unreliable distribution of rainwater (caused partly by human activities)
The effects of pollution, over-exploitation and drought are already being felt, especially among the poor, ranging from serious health problems to suicides among farmers. But it may also result in conflicts among people, states and countries, and between cities and villages.
The so-called “green revolution” has, unfortunately, adversely affected the water situation in India but the introduction of chemical pesticides and fertilizers, water intensive crops and groundwater irrigation in the late 1960s also helped to make India self-sufficient when it comes to food. In fact, since Independence in 1947, India hasn’t experienced any severe famine.63
It could thus be argued that “the green revolution” prevented hunger but created thirst, instead – which may, eventually, lead to hunger again.64
Until now, most of the population growth in India has taken place in rural areas. But in the future, almost all of the growth is expected to take place in urban areas.65
When we take the adverse implications of population growth on water availability into account, it can be said that one of the positive aspects of the urban transition of India is that urban dwellers have fewer children than their rural counterparts.66
Another positive aspect is that this transition doesn’t seem to give people more appetite for meat, at least not nearly as much as has been the case in China.
And while urban dwellers evidently contribute more to the pollution and depletion of water and to climate change than rural dwellers do, Indian cities have a large – and largely unexploited – potential for water conservation and water recycling, including a more efficient distribution of water, better wastewater treatment and more rainwater harvesting than what we are seeing in the present day.
Notes
- Both quotes from: Performance Audit of Water Pollution in India; Comptroller and Auditor General of India; 2011-12 ↩
- Apart from being a sanctuary for India’s national bird and several endangered animals, the Byalkere Peacock Reserve is also said to be the only remaining grassland in Bangalore. ↩
- Source: KSPCB shuts down Ramky’s SWM Landfill at Mavallipura; Environment Support Group; July 12, 2012: http://www.esgindia.org/campaigns/press/kspcb-shuts-down-ramkys-swm-landfill-mav.html (and embedded links) ↩
- Source: Yelahanka; Wikipedia: http://en.wikipedia.org/wiki/Yelahanka (accessed October 22, 2013) ↩
- ”The smaller towns and rural areas do not contribute significant amounts of sewage due to low per capita water supply.” Quoted from: Evaluation of Operation and Maintenance of Sewage Treatment Plants in India; Central Pollution Control Board, Ministry of Environment & Forests; 2007 ↩
- Natural contamination of water in India includes salinity (in Rajasthan, Kerala, Karnataka), iron (in Assam, Bihar, Chattisgarg), nitrate (in Karnataka, Rajasthan, Maharashtra), fluoride (in Rajasthan, Karnataka, Bihar) and arsenic (in Assam, West Bengal, Bihar). Source: Contaminated water stunting growth of Indian kids: UNICEF; Hindustan Times; February 14, 2013: http://www.hindustantimes.com/India-news/NewDelhi/Contaminated-water-stunting-growth-of-Indian-kids-UNICEF/Article1-1011753.aspx ↩
- Source: Water in India: Situation and Prospects; UNICEF, FAO and SaciWATERs; 2013. The salination of soil, surface and groundwater reduces the availability of safe drinking water and arable land. ↩
- Quoted from: Groundwater quality scenario; Central Ground Water Board, Ministry of Water Resources: http://www.cgwb.gov.in/GW_quality.html (accessed October 22, 2013) ↩
- As late as 1951, life expectancy in India was just 32 years. Today, it is 66 years. Source: An Uncertain Glory – India and Its Contradictions; Jean Dréze and Amartya Sen; 2013 ↩
- From 1901–1951, the population of India increased about 50%, from 238 million to 361 million, but from 1951-2001, it almost tripled: to 1,027 million. So far, in the 21st century, the growth seems to have slowed down, possibly as an effect of increased urbanization. Source: Performance Evaluation of Sewage Treatment Plants under NRCD; Central Pollution Control Board, Ministry of Environment & Forests; 2013 (population figures differ slightly among different sources) ↩
- Source: National water footprint accounts: the green, blue and grey water footprint of production and consumption; Mekonnen, M.M. and Hoekstra, A.Y.; 2011 ↩
- Quoted from: Water pollution by industrial effluents in India: Discharge scenarios and case for participatory ecosystem specific local regulation; Rajaram, T. and Das, Ashutosh; 2007 ↩
- Source: Water in India: Situation and Prospects; UNICEF, FAO and SaciWATERs; 2013 ↩
- Quoted from: Excreta does matter; The Centre for Science & Environment (CSE); 2013. Metropolitan, Class-I and Class-II cities, taken together, produce 38,255 Ml of sewage per day, equivalent to about 14 Gm3 per year. This means that if only 20% of this is actually being treated – even though there is capacity to treat 30% – more than 11 Gm3 of untreated sewage is being discharged from Indian cities every year. Source: Performance Evaluation of Sewage Treatment Plants under NRCD; Central Pollution Control Board, Ministry of Environment & Forests; 2013 ↩
- On the average, the individual resident of a metropolitan or class-I city generates 156 liters of sewage per day while the resident of a smaller class-II city generates “only” 90 liters of sewage per day. There are 35 metropolitan cities with a population above 1,000,000, 463 class-I cities with a population between 100,000 and 1,000,000, and 410 class-II cities with a population between 50,000 and 100,000. Source: Performance Evaluation of Sewage Treatment Plants under NRCD; Central Pollution Control Board, Ministry of Environment & Forests; 2013 ↩
- Quoted from: Evaluation of Operation and Maintenance of Sewage Treatment Plants in India; Central Pollution Control Board, Ministry of Environment & Forests; 2007 ↩
- Source: Water in India: Situation and Prospects; UNICEF, FAO and SaciWATERs; 2013 ↩
- “Improved sanitation” is defined in terms of facilities that hygienically separate human excreta from human contact. ↩
- Source: WHO/UNICEF Joint Monitoring Programme for Water Supply and Sanitation: http://www.wssinfo.org (accessed October 22, 2013) ↩
- Source: Performance Evaluation of Sewage Treatment Plants under NRCD; Central Pollution Control Board; Ministry of Environment & Forests; 2013 ↩
- According to legend, the Yamuna and the Ganges merge with a third river, the mythical underground Saraswati, at Allahabad, making this the holiest of any river site in India. Hindus believe that taking a bath here will wash away all one’s sins and free one from the cycle of rebirth. ↩
- Source: India’s Kumbh Mela festival holds most auspicious day; BBC; February 11, 2013: http://www.bbc.co.uk/news/world-asia-india-21395425 ↩
- Quoted from: Failure of Ganga, Yamuna projects no deterrence for TN govt; Times of India; September 4, 2009: http://articles.timesofindia.indiatimes.com/2009-09-04/chennai/28093527_1_cooum-treatment-plants-sewage-treatment. It has been argued that the reason for the failure was the uncritical adoption of a Western system of sewage treatment, which required 24 hours of power supply, when only 8 hours was available. ↩
- Source: Ganges Basin; Wikipedia: http://en.wikipedia.org/wiki/Ganges_Basin (accessed October 22, 2013) ↩
- Source: Clean water still a dream for 4.6 crore; Times of India; September 4, 2013: http://articles.timesofindia.indiatimes.com/2013-09-04/india/41764342_1_drinking-water-habitations-contaminated-water ↩
- Source: Common water and sanitation-related diseases; UNICEF: http://www.unicef.org/wash/index_wes_related.html (accessed October 28, 2013) ↩
- “88% of deaths from diarrhea occur because of unsafe water, inadequate sanitation and poor hygiene”. Quoted from: Facts and figures: Water, sanitation and hygiene links to health; World Health Organization: http://www.who.int/water_sanitation_health/publications/factsfigures04/en/ (accessed October 28, 2013) ↩
- Disability-adjusted life year (DALY) is a measure of overall disease burden, expressed as the number of years lost due to ill-health, disability or early death. Source: Disability-adjusted life year; Wikipedia: http://en.wikipedia.org/wiki/Disability-adjusted_life_year (accessed October 28, 2013) ↩
- Source: Disability Adjusted Life Years In India, 2009 – Estimated Percentage of DALY by Cause; The Government of India: http://data.gov.in/dataset/disability-adjusted-life-years-india-2009-estimated-percentage-daly-cause (accessed October 28, 2013) ↩
- About 4 billion cases of diarrhea per year cause 1.8 million deaths worldwide. Source: Common water and sanitation-related diseases; UNICEF: http://www.unicef.org/wash/index_wes_related.html (accessed October 28, 2013) ↩
- In the year 2008, there were 237,482 children under the age of 5 that died of diarrhea in India. Source: Global, regional, and national causes of child mortality in 2008: a systematic analysis; Robert E. Black et al.; 2010 ↩
- Quoted from: Contaminated water stunting growth of Indian kids; Hindustan Times; February 14, 2013: http://www.hindustantimes.com/India-news/NewDelhi/Contaminated-water-stunting-growth-of-Indian-kids-UNICEF/Article1-1011753.aspx ↩
- “Utilizable resources of water” include rainfall water and water from melting ice in the mountains that can be extracted from rivers, lakes and groundwater each year without affecting availability. In other words, it indicates the limit for the sustainable use of water. ↩
- Source: Water in India: Situation and Prospects; UNICEF, FAO and SaciWATERs; 2013. The 1,123 Gm3 of utilizable water is comprised of 690 Gm3 of surface water and 433 Gm3 of replenishable groundwater resources. ↩
- “Narsimhan (2008) calculated the water budget using an evapotranspiration rate of 65 per cent as against the 40 per cent used in official estimates. The utilizable water for human use thus comes out to be 654 BCM [Gm3], which is very close to the current actual water use estimate of 634 BCM [Gm3], reflecting an alarming situation.” And the study by “Garg and Hassan (2007) reveals that the assessment of utilisable water resources of India are overestimated to the range of 66 to 88%. The authors estimate the utilisable water resources as 668 BMC”. Both quotes are taken from: Water in India: Situation and Prospects; UNICEF, FAO and SaciWATERs; 2013. ↩
- See for instance: Thousands feared dead after Indian monsoon causes extreme damage; The Washington Post; June 25, 2013: http://www.washingtonpost.com/blogs/capital-weather-gang/wp/2013/06/25/thousands-feared-dead-after-indian-monsoon-causes-extreme-damage/ ↩
- 70%, according to: Hot Cities: battle-ground for climate change; UN Habitat; 2011, and 80%, according to: Cities and Climate Change; The World Bank; 2010 ↩
- The annual flow of water through the Ganges and the Brahmaputra has been estimated at 525 Gm3/year and 585 Gm3/year, respectively, while the total amount of water flowing through all the rivers of India has been estimated at 1,869 Gm3/year. Source: The Himalayan Challenge: Water Security in Emerging Asia; Strategic Foresight Group; 2010 ↩
- Such as the dispute between the states of Karnataka and Tamil Nadu over water from the Kaveri (Cauvery). See: Kaveri River water dispute; Wikipedia: http://en.wikipedia.org/wiki/Kaveri_River_water_dispute (accessed October 28, 2013). Other interstate disputes have occurred over water from the Narmada, Yamuna, Godavari, Krishna, Ravi and Beas rivers. In addition, the distribution of river water regularly causes disputes with neighboring countries (especially Pakistan and Bangladesh). ↩
- “The fact is that groundwater now supplies water to about 70% of the irrigated area, and about 80% of domestic water supplies.” Quoted from: India’s Water Economy: Bracing for a Turbulent Future; The World Bank; 2005 ↩
- Source: Deep Wells and Prudence: Towards Pragmatic Action for Addressing Groundwater Overexploitation in India; The World Bank; 2010 ↩
- In the states of Punjab, Rajasthan and Haryana, the annual use of groundwater exceeds the net annual groundwater availability by, respectively, 145%, 125% and 109%. Source: Deep Wells and Prudence: Towards Pragmatic Action for Addressing Groundwater Overexploitation in India; The World Bank; 2010 ↩
- Source: The poor pay more for water than the rich; Livemint; May 2, 2009: http://www.livemint.com/Politics/mE6OiUi59ioGqDoHrd8yUP/The-poor-pay-more-for-water-than-the-rich.html ↩
- Source: Water tariffs and subsidies in South Asia: a scorecard for India; Usha P. Raghupati and Vivien Foster; 2005 ↩
- Private water supply is a huge industry in India: “Annual revenues from the tanker water economy in these six cities [Indore, Nagpur, Bangalore, Jaipur, Ahmedabad and Chennai] alone are reported to be in the region of Rs. 100 crore [1 billion]. Extend the figure to other cities across the country and this may well be the biggest informal industry, thriving solely on the failed municipal water supply system.” Quoted from: India’s water future: Dry days ahead; Dr. Sudhirendar Sharma: http://infochangeindia.org/agenda/the-politics-of-water/indias-water-future-dry-days-ahead.html ↩
- The “water footprint” is a measure of human consumption and contamination of freshwater resources. ↩
- In the period 1996-2005, the average global per capita footprint was 1,385 m3/year. In India, it was 1,089 m3/year and in the United States it was 2,842 m3/year. Source: National water footprint accounts: the green, blue and grey water footprint of production and consumption; Mekonnen, M.M. and Hoekstra, A.Y.; 2011 ↩
- According to figures from the United Nations’ Food and Agriculture Organization, the average American consumed 125.4 kilograms of meat per year while the average Indian consumed only 3.2 kilograms. Source: Kings of the carnivores; The Economist; April 30, 2012: http://www.economist.com/blogs/graphicdetail/2012/04/daily-chart-17 ↩
- The water footprints of beef, pork and poultry are, respectively, 15,400, 6,000 and 4,330 l/kg while the water footprints of wheat, rice and potatoes are, respectively, 1,827, 1,670 and 290 l/kg. Source: Water Footprint Network: http://www.waterfootprint.org (accessed October 28, 2013). ↩
- The global water footprint (of production) in the period 1996-2005 was 9,087 Gm3/year while that of India was 1,182 Gm3/year. Source: National water footprint accounts: the green, blue and grey water footprint of production and consumption; Mekonnen, M.M. and Hoekstra, A.Y.; 2011 ↩
- Source: Draft for National Water Policy; Ministry of Water Resources; 2012 ↩
- Of India’s total water footprint (of production), 64% is rainwater (green), 21% is surface and groundwater (blue), and 15% is polluted water – or, more precisely, the volume of water required to dilute pollutants (gray). The world average is 74% rainwater, 11% surface and groundwater, and 15% polluted water. Source: National water footprint accounts: the green, blue and grey water footprint of production and consumption; Mekonnen, M.M. and Hoekstra, A.Y.; 2011 ↩
- The water footprint related to India’s import of agricultural products (28 Gm3/year) is only 1/4 of the water footprint related to its export of agricultural products (114 Gm3/year), which is about 10 percent of its total water footprint of production (1,182 Gm3/year). Source: National water footprint accounts: the green, blue and grey water footprint of production and consumption; Mekonnen, M.M. and Hoekstra, A.Y.; 2011 ↩
- Both quotes from: Deep Wells and Prudence: Towards Pragmatic Action for Addressing Groundwater Overexploitation in India; The World Bank; 2010 ↩
- Every year since 2001, more than 15,000 Indian farmers have committed suicide. Source: Farmers’ suicide rates soar above the rest; The Hindu; May 18, 2013: http://www.thehindu.com/opinion/columns/sainath/farmers-suicide-rates-soar-above-the-rest/article4725101.ece ↩
- Quoted from: The real threat to our future is peak water; The Guardian; July 6, 2013: http://www.theguardian.com/global-development/2013/jul/06/water-supplies-shrinking-threat-to-food ↩
- The water footprint (of consumption) of agricultural products in India is 1,013.9 m3/year per capita, or 93% of the total water footprint per capita. Source: National water footprint accounts: the green, blue and grey water footprint of production and consumption; Mekonnen, M.M. and Hoekstra, A.Y.; 2011 ↩
- The recommended norms for water supply in India are 30-70 liters/day per capita for rural areas and villages and 100-150 liters/day per capita for towns and cities. Source: National Institute of Hydrology: http://www.nih.ernet.in/rbis/india_information/drinking.htm (accessed December 10, 2013) ↩
- Water intensive agricultural products include sugar, fruit, vegetables, dairy and meat, in addition to soft drinks and other processed beverages. Source: Dietary Intake and Rural-Urban Migration in India: A Cross-Sectional Study; Liza Bowen et al.; 2010. ↩
- 198 million out of a total urban population of 388 million have access to piped water on premises in India. Source: WHO/UNICEF Joint Monitoring Programme for Water Supply and Sanitation: http://www.wssinfo.org (accessed October 22, 2013) ↩
- Source: Only 2 Indian cities have continuous water supply; Business Standard; March 23, 2010: http://www.business-standard.com/article/economy-policy/-only-2-indian-cities-have-continuous-water-supply-110032300101_1.html ↩
- The number of private bore wells in India has been estimated at 25-30 million. This includes wells for agricultural, industrial and domestic use. Source: Source of Life; The Hindu; October 18, 2013: http://www.thehindu.com/features/homes-and-gardens/source-of-life/article5247667.ece. For a description of private water supply in the city of Hyderabad, see: The great water robbery; Times of India; May 17, 2012: http://articles.timesofindia.indiatimes.com/2012-05-17/hyderabad/31748085_1_water-board-tanker-owners-private-tanker-operators ↩
- India has experienced many severe famines, such as the Indian famine of 1896-97, in which five million people perished, and the Bengal famine of 1943, which claimed another five million lives from starvation and epidemics. However, since the beginning of “the green revolution” in the late 1960s, in fact since Independence in 1947, India hasn’t experienced any severe famines. ↩
- Water scarcity may lead to famine because it takes much more water to satisfy hunger than to satisfy thirst: “We drink on average four liters of water per day, in one form or another, but the food we eat each day requires 2,000 liters of water to produce.” Quoted from: The real threat to our future is peak water; The Guardian; July 6, 2013: http://www.theguardian.com/global-development/2013/jul/06/water-supplies-shrinking-threat-to-food ↩
- During the second half of the 20th century, the population of India almost tripled: from 372 million in 1950 to 1,054 million in 2000. Two-thirds of this growth took place in rural areas. During the first half of the 21st century, the population is expected to grow by almost the same number of people – to 1,692 million, but less than 10% of this growth is expected to take place in rural areas. Source: World Urbanization Prospects: The 2011 Revision; United Nations, Department of Economic and Social Affairs: http://esa.un.org/unup/CD-ROM/Urban-Rural-Population.htm (accessed November 5, 2013) (population figures differ slightly among different sources) ↩
- This also explains why population growth in relative numbers is expected to slow down significantly: from 183% between 1950 and 2000 to 61% between 2000 and 2050. Source: World Urbanization Prospects: The 2011 Revision; United Nations, Department of Economic and Social Affairs: http://esa.un.org/unup/CD-ROM/Urban-Rural-Population.htm (accessed November 5, 2013) ↩